2020: A Detailed Look

2020: A Detailed Look

Cambiar President Brian Barish provides an in-depth look at Valuations, Emerging Markets, & the Dollar.

Key Takeaways:

  • In the very short-term stocks are probably over-bought on trade optimism.  Stock pricing appears somewhat demanding in the U.S., less so in the other Developed Markets.
  • We expect an “average” year for U.S. stocks based on zero multiple expansion and some probability that returns are stunted until the November election.  Performance outside of the U.S. should be better.
  • We expect China’s growth rate to slow due to the trade war and apparent shift towards more statism ideology.
  • Budget deficit will likely rise in the U.S. with record low unemployment, leading to potentially a lot of uncertainty.

2019 will be an above-average year for stock market returns unless something weird happens next month.  Something weird did happen in December 2018, so don’t rule it out completely – there was a technical breakdown in the markets that brought about a derivatives-led selling vortex of -16% in the final month of the calendar year, bottoming on Christmas.  So while the S&P 500 is up 25%+ YTD through the end of November (a really good year), it’s up 15% from the end of November 2018 (good, but hardly exceptional).  My account of 2018 is that stocks started the year with few risks priced in, but money supply growth in the U.S. was very weak (<4%), which created selling pressure, and the markets had reasons to fear this becoming worse owing to Fed over-tightening.  Then some version of shallow markets leading to fragile markets kicked in, as liquidity in the December vortex was never very good.  By year-end, a ton of risk was priced in, and as this was reversed in 2019, returns have been elevated.  Realize that the trade war stuff had yet to be significantly ratcheted up in late 2018.  It got ratcheted up in mid-2019, and markets are up anyway.  Pricing, embedded risk, and monetary conditions matter more than the economic outlook.

2020: In the Short-Term

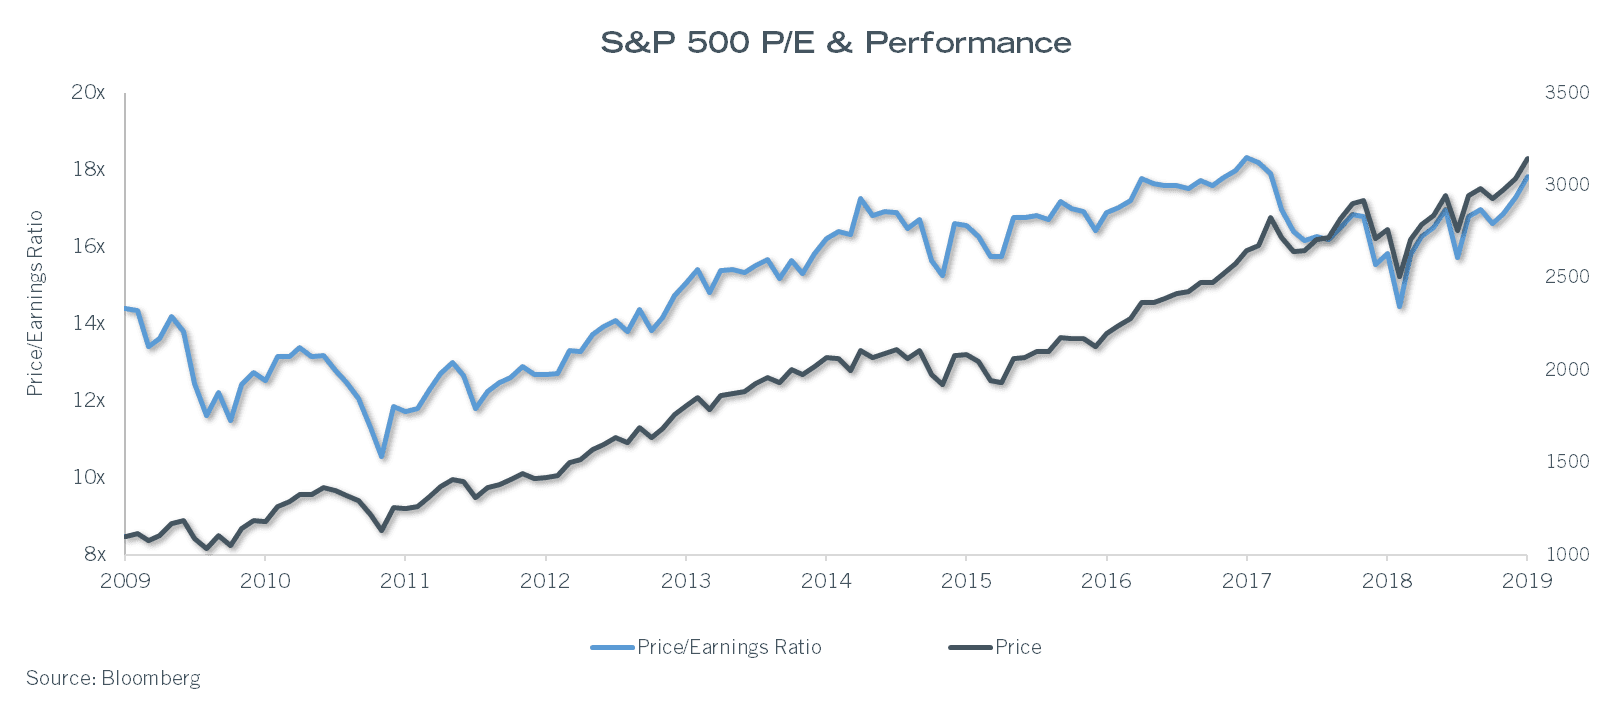
As we enter 2020, stocks in the U.S. look not-dissimilar to how they looked in late 2017/early 2018.  They don’t have a lot of risk priced in, and I would argue in the very, very short term, are probably over-bought on trade optimism.  Unlike early 2018, the rest of the world remains relatively well-risked with some decent probabilities of positive “surprises” such as a Brexit resolution or relatively better GDP/demand.  Also, unlike the end of 2017, we do not have the prospect of an active Fed double-tightening monetary conditions through rate increases and balance sheet shrinkage.  The Fed is short-term increasing its balance sheet and will likely not make any moves in 2020.  A quiet Fed is a good Fed.

EAFE Index – Does not look nearly as demanding… (some of this is weak currency though).

Emerging Markets Index – Let’s just say thankfully this is not an important product area for Cambiar!  There is no return pattern that I see, it just seems to go sideways.

To Summarize – Stock pricing is somewhat demanding in the U.S., less so in the other Developed Markets, but monetary conditions are stable/favorable, as compared to tightening in 2018 and loosening in 2019.  Looking at the 1-year forward PE of the U.S., it has not sustained anything over 18x post-GFC, and currently sits at 17.7x.  That isn’t a call for sell everything (the market seems to be happy in the 16-17x range).  But one would not expect a lot more from here.

For EAFE, the picture is arguably better – EAFE trades at 14.3x forward and seems to top out at 16x.

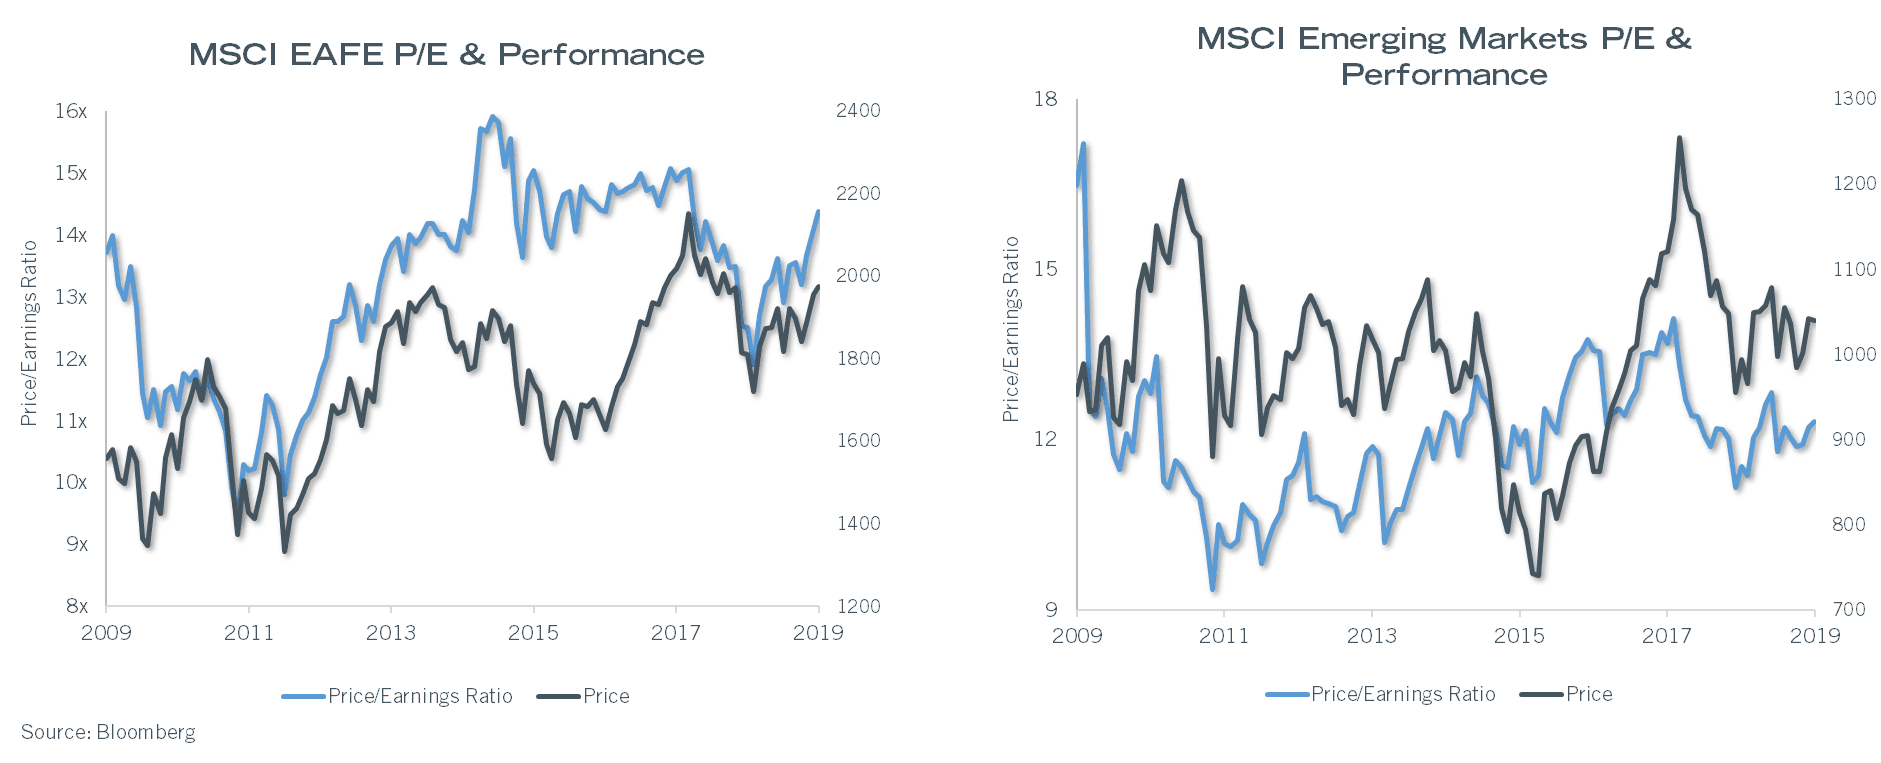
For the curious, the Emerging Markets index blended multiple sits at 12.3x, which sounds attractive until you look at the LT range.  It is similarly about one multiple point way from where it tends to top out.  This index really needs to be cleaned up given all the state-related companies that reside in it.

The Longer-Term Issues

Structurally Lower Growth (SLOG)
LowFlation
Dollar Hegemony

For most, if not all of the 2010s, growth in the developed world can be summarized by the acronym SLOG, or structurally lower growth.  The precise rate of such growth does differ by country/region, but the trends are fairly clear, and we don’t see a clear case for growth rates to vary a great deal from trend levels prospectively.  For the U.S., Europe, and Japan, it’s probably best to consider the Long Term Trend or LTT, and variances around the LTT:

  • The LTT growth rate for the U.S.is about 2.0%
  • The LTT growth rate for Europe is about 1.0%
  • The LTT growth rate for Japan is a bit less at perhaps 0.8%

In a given year, fiscal policies or inventory movements can add or subtract about 0.6% to these figures.  In our view, the markets tend to over-interpret these variances because the base LTT rates are so low.  In other words, if Europe has a down year relative to its LTT because of inventory movements (owing to global trade and idiosyncratic factors) and it shaves about 0.5% off, that cuts growth in half to near recessionary levels.  This has been the story in late 2018 and most of 2019, in big Eurozone exporter countries like Germany and Italy; countries big enough to drag the whole region down.  Japan has somehow managed to be more stable in 2016-19.  For the U.S., a comparable decline happened in 2016 (commodity crash mostly) and took growth to 1.6%, with cyclicals underperforming.  Conversely, U.S. growth zoomed to 2.9% in 2018 on the back of material tax cuts but will fall closer to the LTT at 2.3% in 2019 as this benefit fades.

With trend growth this low, building any inflationary pressure has been nearly impossible in developed economies, and excess capacity situations in various industries can quickly become problematic to profitability/pricing.

For 2020, current (consensus) estimates for growth are for the U.S. to decelerate back to the LTT of 2% as the fiscal benefit of the 2017 tax cuts fully tapers out.  Eurozone growth should accelerate slightly from <1% in 2019 to 1.2% in 2020, ostensibly as comps will be easier and there may be some inventory rebuilding (looking at the European data, growth is a lot better in little Eurozone countries like the Balkans and Baltic states; the big ones drag the numbers down).  Japan consensus growth is forecasted to reside closer to an LTT rate at 0.6-0.7%I.

With trend growth this low, building any inflationary pressure has been nearly impossible in developed economies, and excess capacity situations in various industries can quickly become problematic to profitability/pricing.  All developed markets have articulated inflation goals of 2%, with a tolerance for something higher than that for a few years to create more monetary policy capacity.  These goals appear to be very wishful thinking.  Eurozone inflation has never broken above 2% in any post-crisis recovery years and has averaged closer to 1%.  U.S. core inflation hit the magic 2% in 2018 but has consistently averaged closer to 1.5% in the 2010s.  Japan predictably punches in below 1% inflation but is at least not deflating.  Lowflation remains a persistent reality in all developed markets but is more acute outside the U.S.

For these reasons – low LTT/SLOG, lowflation, nobody coming close to making their inflation goal – interest rates remain extremely low with the U.S. at a positive neutral interest rate, while European and Japanese central bankers continue to try to stimulate with negative rates (NIRP) and ongoing QE of varying magnitudes.  Smaller central banks in Europe, such as Switzerland and the Nordic countries, are using more substantial negative rates as a form of insect repellent just to keep capital flows out of their home monetary systems.

There is some open question by many investors and economists whether this continues to make sense – if inflation were to accelerate from extensive QE and negative rates, shouldn’t it have happened by now?  We are not able to run alternative experiments in real-time and can only speculate, but there is some potential downside to permanent QE and NIRP in that it likely distorts asset prices and risk tolerances, leading to resource misallocation and systemic risks the longer it goes on.  There is some evidence to the latter – there is almost no question that persistent low rates have led investment-grade companies to augment their borrowings for M&A or capital structuring.  Corporate debt loads in the aggregate are not alarmingly high, but there are clear pockets of excess debt that have been harbingers of poor stock performance, such as specialty pharma a few years ago or consumer staple names more recently.  Debt binges are almost always a bad idea.

This is one of several reasons why PE multiples are higher in the U.S. than elsewhere – it’s hard to buck the question of what regional growth rates and financial conditions would look like if central banks stopped trying to reach apparently unreachable inflation targets and focused on more sustainable monetary conditions.  Would these countries and their financial systems blow up, or would growth rates just hold in closer to the LTT?  Nobody knows, not really.  There are some arguments suggesting that the ultra-low rates propagate lowflation by collapsing inflationary expectations and permitting questionable industrial capacity to service debts and persist indefinitely (the zombie company issue).  This again is one of those unanswerable hypotheticals.

Emerging Markets

With China as the tip of the spear in Emerging Market-land, it’s difficult to get really excited about the aggregate outlook…

Emerging Markets are dominated statistically by China and commodity producers such as Brazil, Chile, Russia, and South Africa, where the performance of the former has tended to influence the performance of the latter.  China’s LTT is clearly decelerating – whereas it used to be in the 8-9% range it has fallen to the 5-6% range more recently and probably will decline to the 3-4% range in the early 2020s.  The trade war has hurt this growth rate while a crackdown on informal lending circuits probably took a couple points off in the 2018-19 time period.  There are still more people to move out of agrarian life, into cities and a commercial life, but not as many as before, and export-led growth opportunities are more limited.  China is trying to climb the value-added ladder but is stunted by trade restrictions and the functional challenge of displacing global leaders in higher value-added products.

It isn’t news that China is slowing, and if LTT growth is still 4-5% in this very large country, that would still be a global needle-mover.  However, China seems to be moving, for ideological reasons, further towards statism and deep influence of the communist party in all manner of daily life, perhaps explaining the vehemence of the protest movement in Hong Kong.  Hong Kong is not its own separate sovereign entity but was promised a separate system in 1997 until its full merger into China in 2047.  Thus, roughly halfway through the separate but not sovereign phase, tensions are mounting on what this really means, and the answers do not appear very comforting.

At an economic development level, China – under current leader Xi Jinping – has emphasized growth of state-owned enterprises (SOEs) over private sector growth, with substantial debt accumulation occurring in this process.  China’s internal corporate debt has risen significantly this decade, with SOE’s % of the total debt more than doubling to ~85% of debt currently from a low 40% range early this decadeI.  There are few, if any historical examples of state-owned corporate growth leading to great efficiency and superior national growth, and this seems to be about consolidating more power for the Communist government and its influence.  Not a good formula.  China may be setting up to be the next Japan with an immense internal debt, enough savings, and an adequate ability to plug FX leakage as to keep the system going.  With Xi in for a lifetime term (he’s only 66), there is little prospect of a change from this path.  Thus China’s LTT may continue to fade to that of developed nations in coming years.

With China as the tip of the spear in Emerging Market-land, it’s difficult to get really excited about the aggregate outlook.  In particular, further slowing of China is not good for the commodity complex.  We have exposure to specialty industrial/precious metals and a modest hydrocarbon exposure, and that is basically it.

Near Term Outlook

The absence of further tweetstorms or prospects for tariff variances are probably enough to start up the global supply chain/inventory cycle.

From a bigger picture economic perspective, limited internal demand in the developed world ex-U.S. places undue pressure on the U.S. and Chinese growth to fill the void.  The trade war and vague but persistent threats of escalation have had a chilling effect on the locals in China, on the willingness of businesses to add capacity in China (versus alternative sourcing), on inventory stocking levels (very low), and on long term planning horizons.  Though the data has generally been poor in 2019, the rates of decline in inventories and business conditions for manufacturing companies seem to be bottoming out recently.

The White House trade/economic team have teased out a “phase one deal” enough times that the market does believe one is pretty close, and it does make sense from an election politics point of view to get something over the goal line.  The absence of further tweetstorms or prospects for tariff variances are probably enough to start up the global supply chain/inventory cycle.  This will be good (short term) for earnings in more cyclically geared areas.  Longer-term, SLOG and Lowflation factors have proven very durable, so… we will focus on buying good businesses that are not overly dependent on elevated cyclical conditions to propel returns.

U.S. ISM Index – Trade policies have taken to a decade low…

Dollar Hegemony

In the decade of the 2000s, the United States’ combined trade and budget deficits (also called the current account) reached post-WWII highs, which lead to the U.S. sending many $trillions of greenbacks abroad to finance these gaps.  The dollar has been the world’s primary reserve currency for the last 75 years and this more liberally available supply of dollars led to a megabull market for commodities, ebullient emerging market financial conditions, and a lower trading value (weak dollar) for most of the 2000s.  Some speculated the dollar would become much less prominent on the global financial stage, with the Euro and Renminbi possibly gaining in share of reserves.  In the 2010s, no such thing has happened, and if anything, the dollar has become more prominent.  There do not at this time appear to be any credible challengers to the dollar’s pre-eminent status. Tighter global dollar availability isn’t good for non-U.S. financial returns or conditions.

The roots of this lie in the challenges of the possible contenders for reserve currency share and in the U.S.’s resurgence in the 2010s.  Given the persistence of SLOG and Lowflation, with these issues afflicted developed market economies to a much greater extent than we have witnessed in the U.S. post-2008, the ECB, Bank of Japan, and peripheral European CBs have gone deep into unconventional monetary policy applications with limited results to date.  Negative rates mean it costs money to hold savings in Euros and Yen, and the “what-if” issue should unconventional policies be lifted remains difficult to answer.  Thus the Yen and the Euro have limited applicability as reserve currencies.  China has not and does not appear able to make the Renminbi freely convertible – money would leak out very quickly if they did; thus it fails the reserve currency test outright.  Which leaves the dollar, alone and actually earning its holders some seignorage in the process, to dominate reserve currency calculations globally.  This means most products – from grains to oil to jet aircrafts to computers – are invoiced in dollars, cost across national borders in dollars, with future buyers and sellers and suppliers hedging into dollars.  The network and habits effects are very powerful, and difficult to break.

From the North American side, the U.S. managed to greatly reduce external deficits that had been “structural” in the 1990s and 2000s, as the value of commodity imports has plunged from the shale oil boom, and most foreign branded cars are produced in North America with NAFTA-supplied parts.  There remains some lighter manufactures such as consumer electronics, toys, and textiles, that do not appear likely to be produced onshore in the U.S.  Net – the yawning current account deficits of the 2000s are no more – which means dollars are not as plentiful ex-U.S., which based on how vital dollars are to the global monetary system, serves as a limiting factor.

Manager:
Cambiar President Brian Barish provides his market outlook as we head into the next decade.

At the end of the 2010s, it is difficult to identify a roadmap to some different version of the world’s strong demand for dollars.  Perhaps the best we can hope for is that the U.S.’s current account deficit begins to widen owing to the fiscal side.  This… seems possible in the 2020s.

The U.S. has led the world in tech, in financial distress and recoveries, and in novel monetary policies/applications.  It seems likely that the U.S. will lead the rest of the world in gigantic structural budget deficits in the 2020s.  This is breaking new ground, to have $1 trillion in deficits and unemployment at a 60 year low!  There are demographic trends in the U.S. that will almost certainly cause deficits to rise, and politically speaking, the winner of the 2020 election will be a spender, it just depends on who.  It is entirely unclear whether deficits of this magnitude are a good thing or an idiotic thing.  It does seem to me that the “traditional fiscal conservative” playbook is gone, and the world, for now, needs more/wants more U.S. government debt.  Combined with some form of renormalization of monetary policy away from negative rates in Europe, this could lead to all kinds of places.  Perhaps the dollar becomes less dominant, or at least more widely available, leading to a weaker dollar versus the 2010s.  This would be beneficial on balance for international financial conditions.

Disclosures

IBloomberg

Certain information contained in this communication constitutes “forward-looking statements”, which are based on Cambiar’s beliefs, as well as certain assumptions concerning future events, using information currently available to Cambiar.  Due to market risk and uncertainties, actual events, results or performance may differ materially from that reflected or contemplated in such forward-looking statements.  The information provided is not intended to be, and should not be construed as, investment, legal or tax advice.  Nothing contained herein should be construed as a recommendation or endorsement to buy or sell any security, investment or portfolio allocation. 

Any characteristics included are for illustrative purposes and accordingly, no assumptions or comparisons should be made based upon these ratios. Statistics/charts may be based upon third party sources that are deemed reliable; however, Cambiar does not guarantee its accuracy or completeness.  As with any investments, there are risks to be considered.  Past performance is no indication of future results.  All material is provided for informational purposes only and there is no guarantee that any opinions expressed herein will be valid beyond the date of this communication.