Midterm Election Years – Correction & Rebound
We examine market movements during midterm election years.
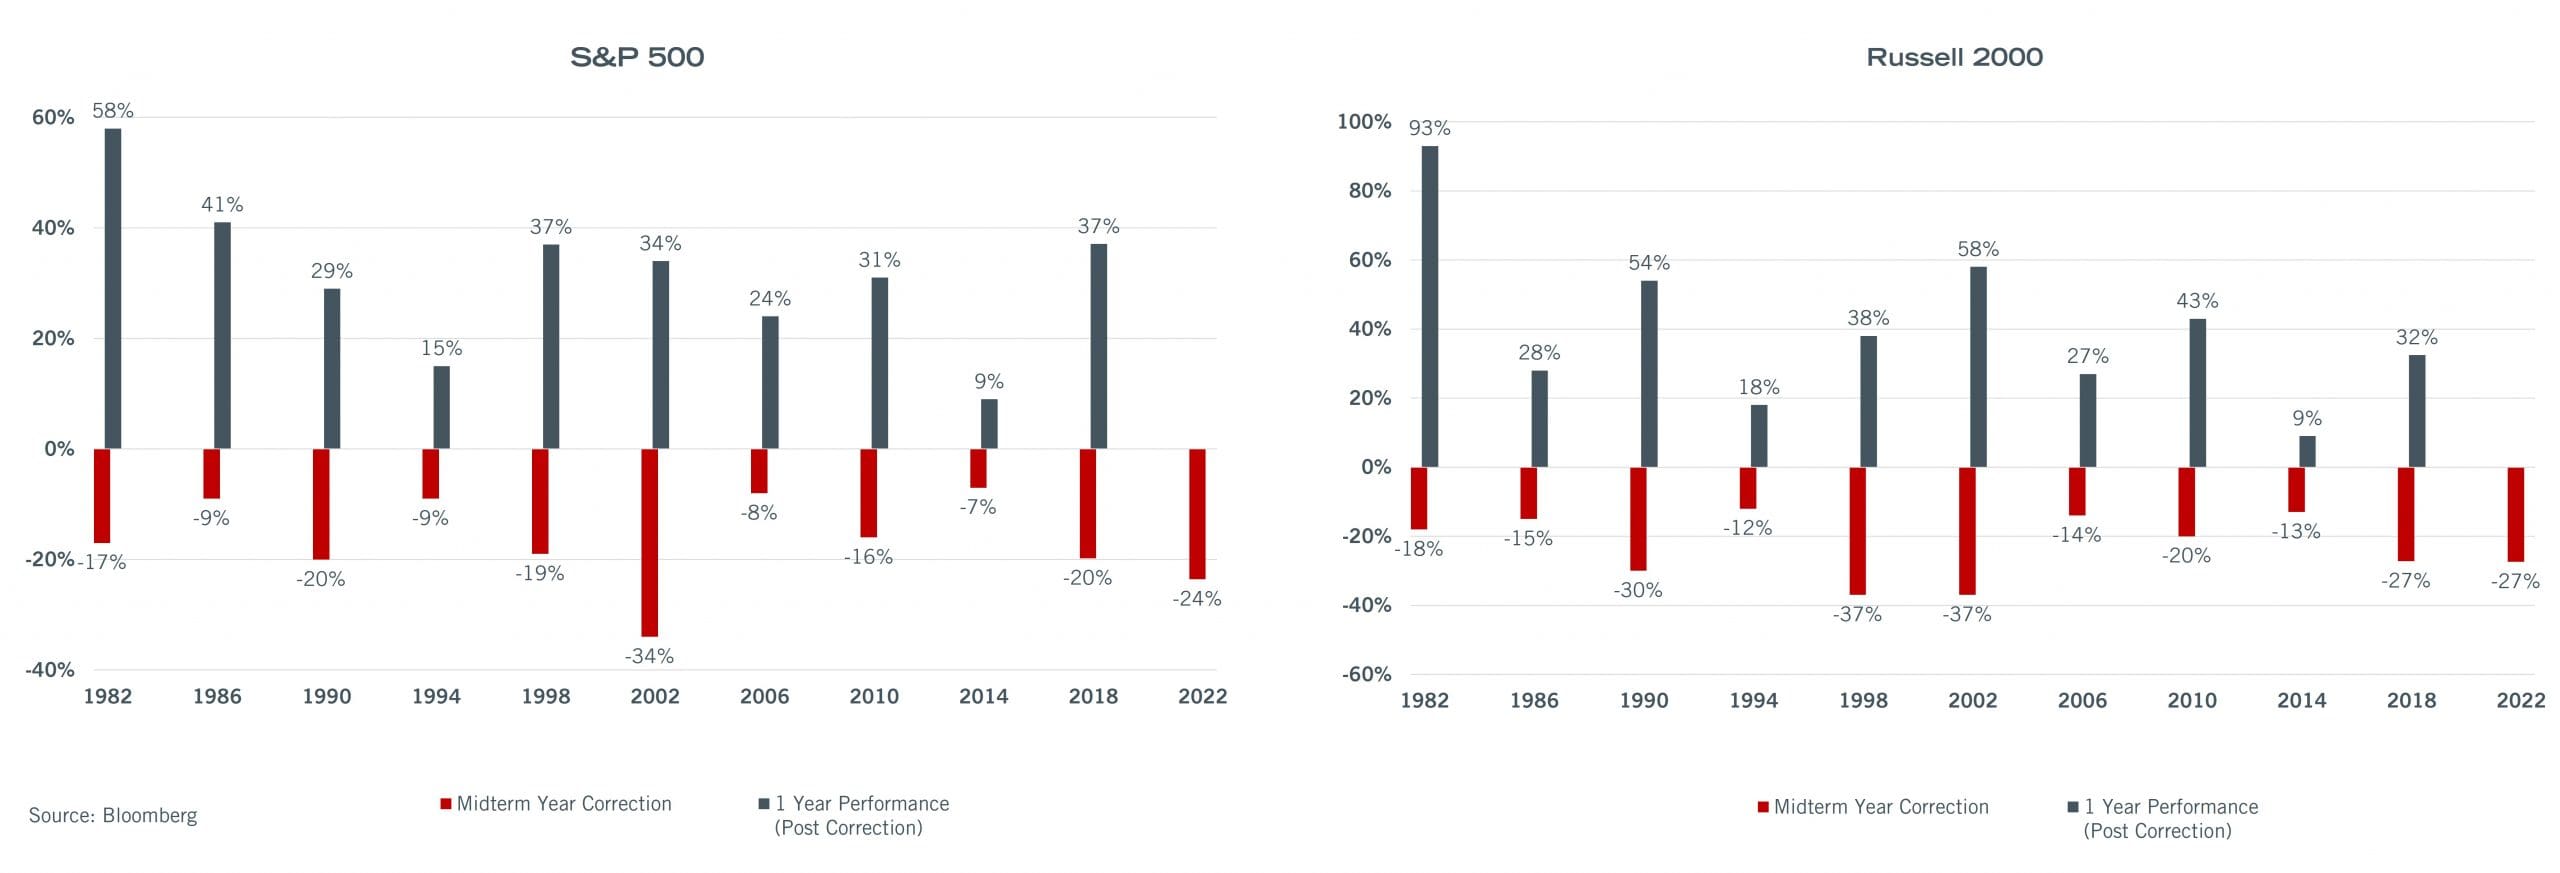
The recent market pullback should not come as a surprise as past midterm elections have often coincided with elevated market volatility – with an average intra-year market correction of -17% for the S&P 500 and -23% for small-cap stocks.
Investors who stay the course through these pre-midterm drawdowns are often rewarded via a subsequent rally in equities. The average one-year performance, post-correction, for the S&P 500 has been 32%, while the Russell 2000 has returned 40%, respectively.
Thus far, 2022 has played out in a similar fashion – as various political and market uncertainties have resulted in a broad-based correction in equities. Cambiar believes this type of indiscriminate selling can create buying opportunities for various high-quality franchises.
Certain information contained in this communication constitutes “forward-looking statements”, which are based on Cambiar’s beliefs, as well as certain assumptions concerning future events, using information currently available to Cambiar. Due to market risk and uncertainties, actual events, results or performance may differ materially from that reflected or contemplated in such forward-looking statements. The information provided is not intended to be, and should not be construed as, investment, legal or tax advice. Nothing contained herein should be construed as a recommendation or endorsement to buy or sell any security, investment or portfolio allocation. Securities highlighted or discussed have been selected to illustrate Cambiar’s investment approach and/or market outlook and are not intended to represent the performance or be an indicator for how the accounts have performed or may perform in the future. The portfolios are actively managed and securities discussed may or may not be held in client portfolios at any given time.
Any characteristics included are for illustrative purposes and accordingly, no assumptions or comparisons should be made based upon these ratios. Statistics/charts may be based upon third-party sources that are deemed to be reliable; however, Cambiar does not guarantee its accuracy or completeness. Past performance is no indication of future results. All material is provided for informational purposes only, and there is no guarantee that the opinions expressed herein will be valid beyond the date of this communication.